Login with SSH key
Putting your password every time you log into a server via SSH can be tiresome, especially if your password is long. One way to make life easier and safer is by using SSH keys.
- In the terminal of your local machine, type in
ssh-keygen. By default, the keys will be exported to~/.ssh/id_rsa; using the default is okay in most cases, but if you have multiple keys and want to avoid conflicts, you can change the destination. - When it prompts you to enter a passphrase, you can click Enter (empty passphrase) so that you don’t need to input anything when you log in to a server using this key pair. But for better security, a passphrase is suggested.
- Copy your SSH public key into the server by
ssh-copy-id -i ~/.ssh/id_rsa.pub user_name@server_address(change the path to the public key if you’ve saved it somewhere else). You’ll be prompted to enter your password at the server. - Log in to the server by
ssh user_name@server_address. You should be able to log in without having to enter your password! If it doesn’t work, check the permission of the~/.sshfolder on your server. Only you should have write access to it. You can change its permission from your home folder bychmod 700 .ssh.
Change the default plotting settings for Matplotlib and Jupyter
Many people explore and analyze data with the powerful combination of Matplotlib (along with Seaborn) and Jupyter Notebook/Lab. This widely favored choice provides a flexible environment for data visualization. However, it’s important to note that the default settings of these tools may not always meet field-specific requirements. To address this, I have compiled a list of modifications that I personally introduced to the configuration files of Jupyter and Matplotlib. These changes allow for customization and tailoring of their default behaviors to suit individual needs better.
Change default font styles in Matplotlib
Scientific publishers often have customized guidelines for figure fonts to ensure optimal print readability. They may specify requirements such as setting the typeface as Arial or Helvetica, with a minimum font size of 5 pt and a maximum size of 7 pt. Unfortunately, the default font styling in Matplotlib/Seaborn is optimized for screen reading. As a result, many researchers manually adjust the font sizes of their generated figures in image editing software like Illustrator or Affinity Designer. This tedious process can be time-consuming and prone to error. By making necessary modifications to the configuration files of Jupyter and Matplotlib, we can ensure that our plots are in a publication-ready state from the very beginning, saving valuable time and effort. Here, I will show you how to change the default font size for matplotlib:
- Locate the configuration file for matplotlib by running the following code in a Python session:
1
2
import matplotlib
print(matplotlib.matplotlib_fname()) - Open the configuration file, locate the default settings that you want to override.
figure.titlesize: Font size of the figure titleaxes.labelsize: Font size for $x$ and $y$ labelsxtick.labelsizeandytick.labelsize: Font size for the $x$ or $y$ tickslegend.title_fontsize: Font size for the title of the legendlegend.fontsize: Font size for legends
- If there’s a
#right before the option, it means this option is commented and will not be considered by matplotlib. So to make it effective, remove the#first, then change the values to the ones you desired. - Save the file, and go create new figures.
Here is the actual settings that I usually use:
1 | font.sans-serif: Arial, Helvetica, DejaVu Sans, Bitstream Vera Sans, Computer Modern Sans Serif, Lucida Grande, Verdana, Geneva, Lucid, Avant Garde, sans-serif |
If you are looking for a one-time change, you can override these values in RcParams:
1 | plt.rc('font', size=5) # controls default text sizes |
Note: if you set the font sizes to 5~7 pts, you may also need to scale down the figure size. The default figure size is $6.4\times4.8 $ inches, I usually set the default as:
1 | figure.figsize: 3.2, 2.4 # figure size in inches |
Make figures in Notebook more clear
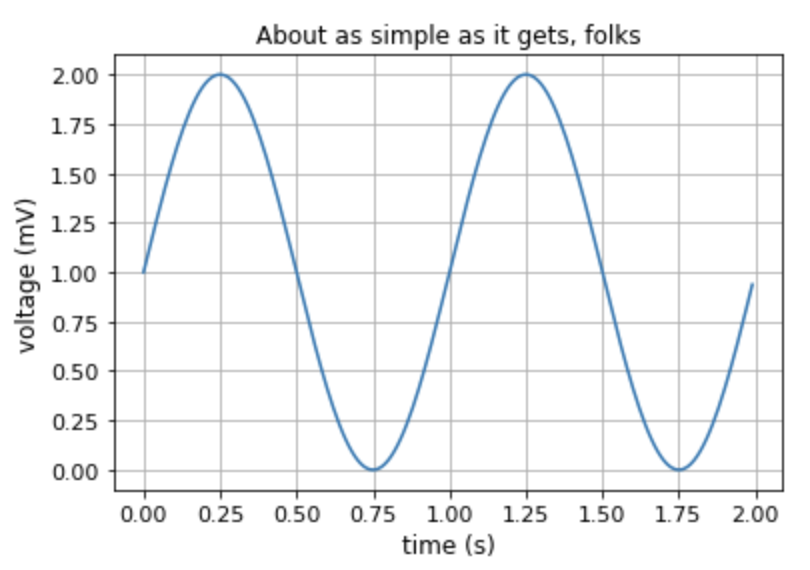
For high-definition screen users, especially for people who are using Macbook and iMac, the inline figures shown up in Jupyter Notebook/ Lab can be very blurry, like the this one:

To solve this problem, you can execute the following command in the notebook that you want to get high-resolution figures:
1 | %config InlineBackend.figure_format='retina' |
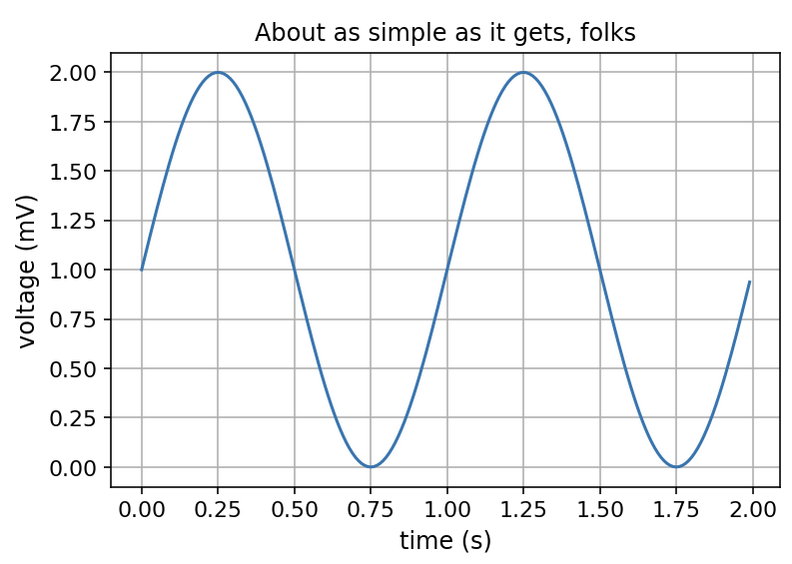
Now output figures will be much more clear:

The major drawback for the above method is that you have to execute it every time you create a new Notebook. If you want Notebooks to produce high-def figures by default, you’ll need to modify the configuration files for IPython (which Notebooks use it to run actual codes):
- Check if you’ve already had a configuration (
ipython_kernel_config.py) for IPython created before. For Linux and MacOS users, the file is usually located at~/.ipython/profile_default, if you don’t know where it locates, you can useipython locateto figure it out; if the file is not in this destination, you can runipython profile createto create it. - Add
c.InlineBackend.figure_formats = ["retina"]orc.InlineBackend.figure_formats = ["svg"]to the end of this file (ipython_kernel_config.py). - Kill your Jupyter Notebook / Lab, and rerun it.